 Канал на RUTUBE:
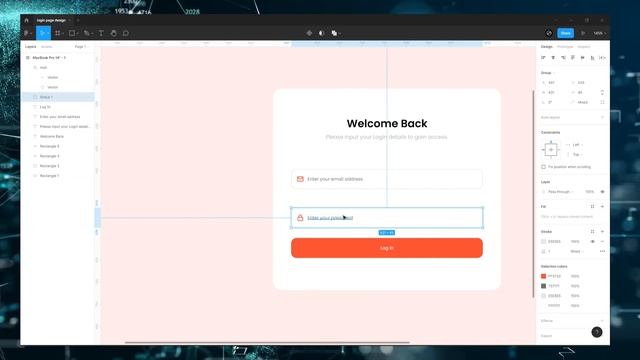
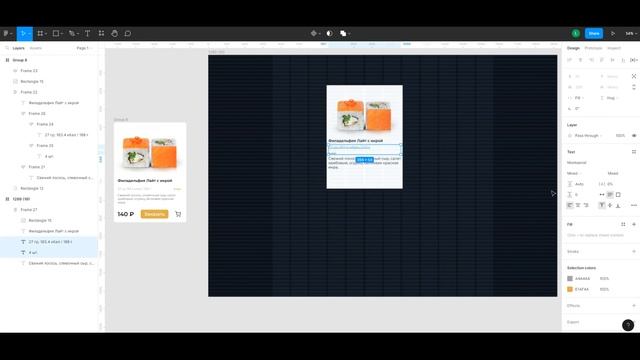
In this video I do a Power BI report design makeover with the help of Figma.
The sales report has 3 dashboards and I create the design based on AI generated pictures from Midjourney.
?Download Link?
? IG:
? Dribbble:
Since many of you asked how I learn Power BI here are some books I vouch for.
I like to learn from books because they provide a complete structure and they answer many questions I didnt even know I need to ask not only as a beginner.
I didnt read all of them form cover to cover yet but they gave me great value already nonetheless.
Amazon links to the books:
? Data visualization
Storytelling with Data
It is my 1 recommendation.
If you dont read anything else just read this and you will be ahead of the majority of the Power BI developers in dataviz.
The Big Book of Dashboards
It is another great book and ithas many use cases if you want to dive deeper.
?DAX
Supercharge Power BI
A great book for beginners covers the most crucial DAX topics.
The Definitive Guide to DAX
The holy book of DAX but more advanced.
?Power Query Data Modeling
Master Your Data with Power Query
This book gets you started very quickly with Power Query and ETL.
The Data Warehouse Toolkit
Data modelling is so important.
Better data model simple DAX and faster reports! Read the first 2 chapters to get the basics.
Dive eeper into specific chapters later on.
These are Amazon affiliate links which provide a small commission to this channel via anything purchased via these links.
Timestamps:
00:00 1 Intro
01:33 2.1 Homepage Figma
04:02 2.2 Homepage putting it together
07:14 3.1 Sales page Power BI
10:33 3.2 Sales page Figma
19:02 3.3 Sales page putting it together
22:55 3.4 Sales page filter pane Figma Power BI
26:57 4.1 Ratings page Power BI
29:05 4.2 Ratings page Figma
30:07 4.3 Ratings page putting it together
33:45 5 Finished design outro
yourownkpi yokpi
Источник: rutube.ru